Some of our specific WURFL device detection capabilities identify physical elements of devices (smartphones, tablets, etc.). With this information our customers can pinpoint and target ads to newer devices, or older devices, depending on their desired demographic. Here’s an example, a customer is advertising luxury shoes, something the average person probably couldn’t afford on regular basis. So they take the physical attributes of the most recent and most expensive phones, like the Apple iPhone X, and only deliver ads to devices with these physical traits. This can increase advertising ROI, clicks, and engagement.
Changes in physical dimensions from 2015 Q1 to 2018 Q1 are on full display in our 2018 Q1 Mobile Overview Report (MOVR) which will be published shortly. Below are some snapshots of the difference in physical traits including weight, thickness, size, and bezel size. One thing’s for sure, what a difference just three years makes.
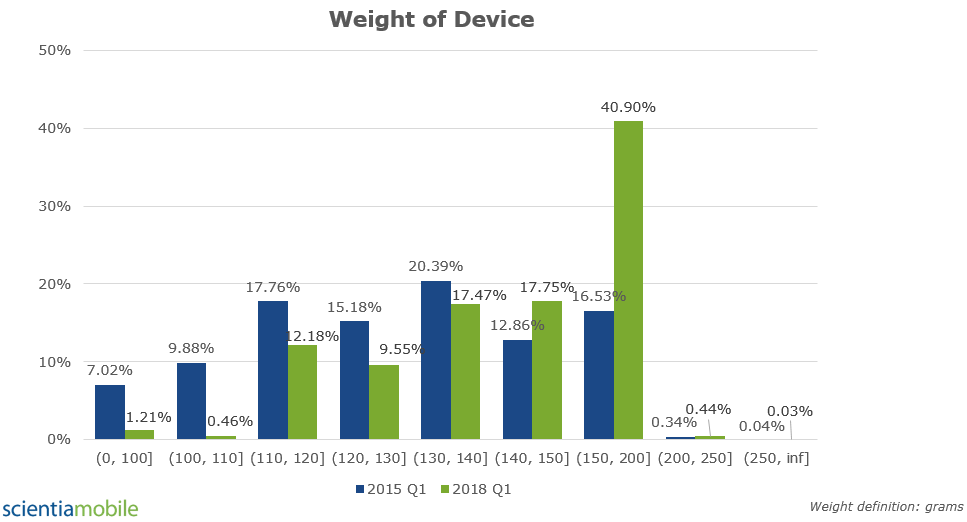
Weight of Device
In 2018, the (150g, 200g] was the most common device weight with 40.90% usage globally. In 2015, (130g, 140g] was the most commonly used device weight with 20.39% usage. The growth in (150g, 200g] weight devices from 2015 to 2018 was 24.37%. The decrease in (130g, 140g] weight devices from 2015 to 2018 was 2.92%.

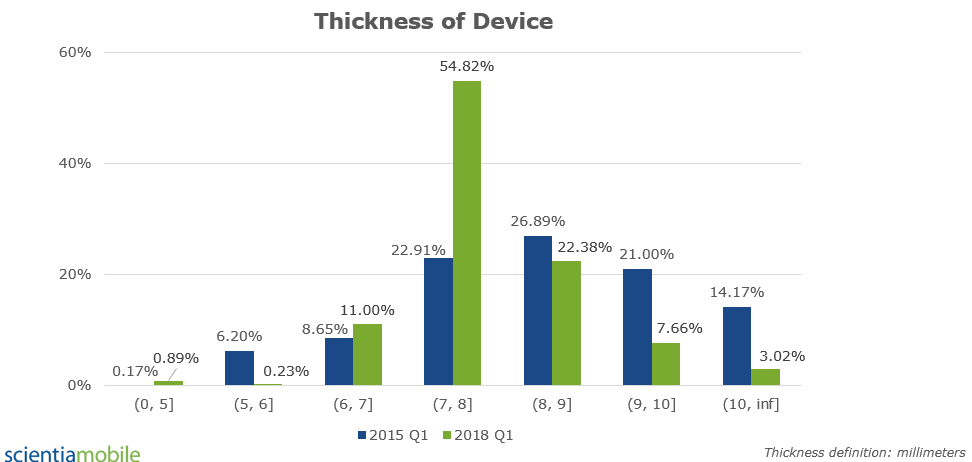
Thickness of Device
In 2018, the most popular thickness of device was (7mm, 8mm] with 54.82% global usage. In 2015, the most popular thickness of device was (8mm, 9mm] with 26.89% global usage. The growth in (7mm, 8mm] device thickness from 2015 to 2018 was 31.91%. The decrease in (8mm, 9mm] device thickness from 2015 to 2018 was 4.51%.

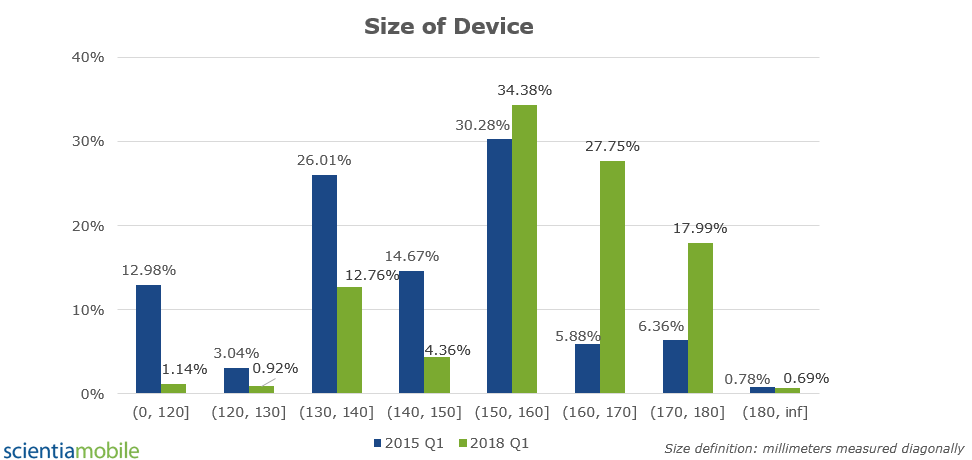
Size of Device
We categorized the “size of device” as the diagonal physical size in millimeters and found that in 2018, the most popular size of device was (150mm, 160mm] with 34.38% global usage. In 2015, the most popular size of device was also (150mm, 160mm] with 30.28% global usage. The growth in (150mm, 160mm] device size from 2015 to 2018 was 4.1%. The trend from 2015 to 2018 is for larger sized devices, with the 2nd and 3rd place sizes moving from (130mm, 140mm] and (140mm, 150mm] in 2015 to (160mm, 170mm] and (170mm, 180mm] in 2018.

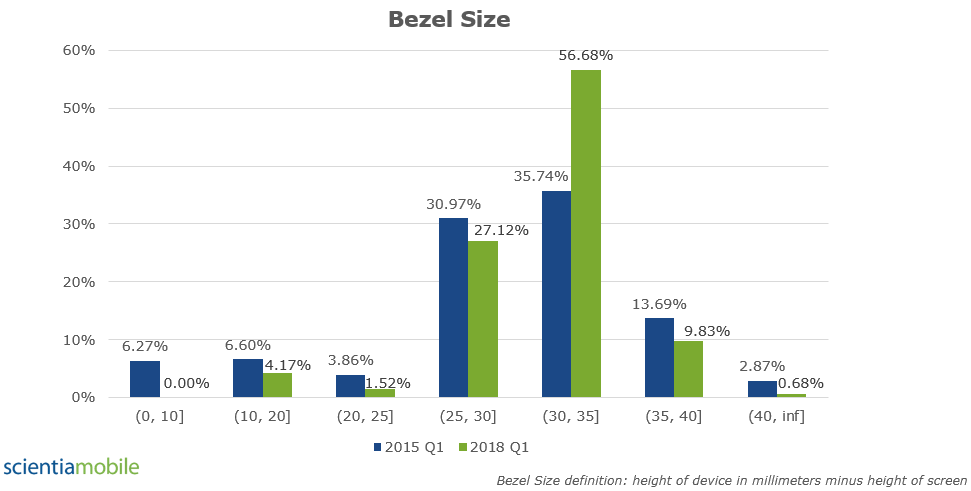
Bezel Size
Unlike the “size of device”, bezel size measures the device length or height, not at a diagonal, in millimeters, then subtracts the length or height of the screen. In 2018, the most popular bezel size was (30mm, 35mm] with 56.68% global usage. In 2015, the most popular bezel size was also (30mm, 35mm] with 35.74% global usage. The growth in (30mm, 35mm] bezel size from 2015 to 2018 was 20.94%. The trend from 2015 to 2018 is for closer to (30mm, 35mm] sized bezels, with the 2nd and 3rd place sizes in 2015 and 2018 being the same (25mm, 30mm] and (35mm, 40mm], but decreasing.


