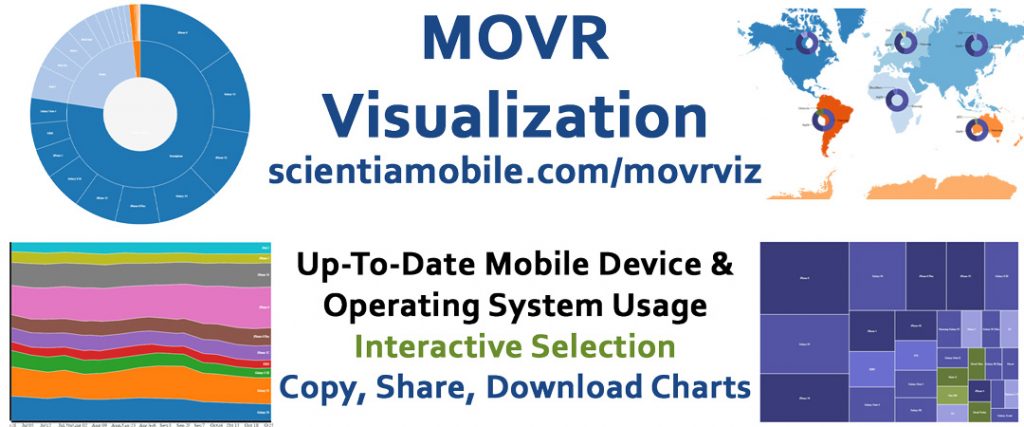
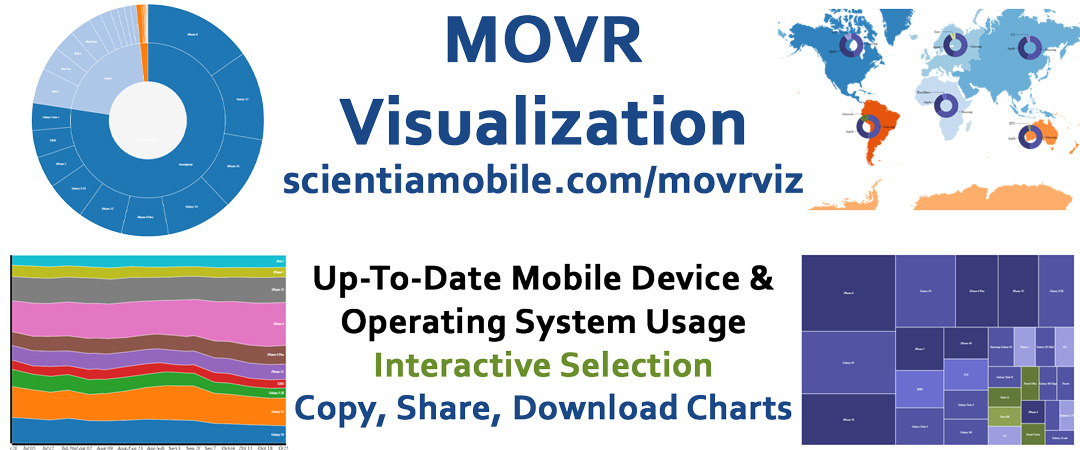
On November 6, we released our MOVR report for 2015 Q3, providing timely information on mobile device usage around the world. At the same time, we introduced our MOVR Visualization tool.
For users of MOVR data, you will find this interactive tool very helpful and informative. You can:
- Select a timeframe: We provide weekly updates of MOVR mobile device usage data
- Select a region: You can lookat the global trends of mobile device usage or drill down on a continent
- Select a manufacturer: Select from the world’s top 15 device manufacturers
- Select a form factor: Narrow down to Smartphones, Tablets, or Feature phones
- Select a chart type: Trend, Starburst, TreeMap, WorldMap
- Save to image: Download a high-quality PNG of the chart you have generated
- Share via URL: Copy the URFL of the chart. That way you can share it easily or dynamically insert it into your our report.
- Download information: Combine the raw information with other data sets for even more insights into mobile device usage.
To get full access to MOVR Visualization, you need to register for a free ScientiaMobile account. Current WURFL or ImageEngine customers are already registered.


