By Andrea Castello and Luca Passani
Splunk is a data collection, aggregation and analysis software used in many different areas: application monitoring, cybersecurity and analysis of web traffic and information coming from many devices. If you are familiar with the Elastic suite of products (whose integration with WURFL we discussed previously), it is probably fair to characterize Splunk as the enterprise alternative to the ELK stack (Elasticsearch, Logstash and Kibana).
This blog post discusses the integration of WURFL device detection with Splunk and assumes that you are familiar with the Splunk product suite. As you probably know, Splunk’s ability to digest and manage large amounts of machine-generated data can be augmented with the help of Apps and Technology Add-ons (TAs). While apps are generally more complex and come with a UI part, add-ons are smaller, reusable components that Splunk uses to import, normalize and enrich data from different data sources,
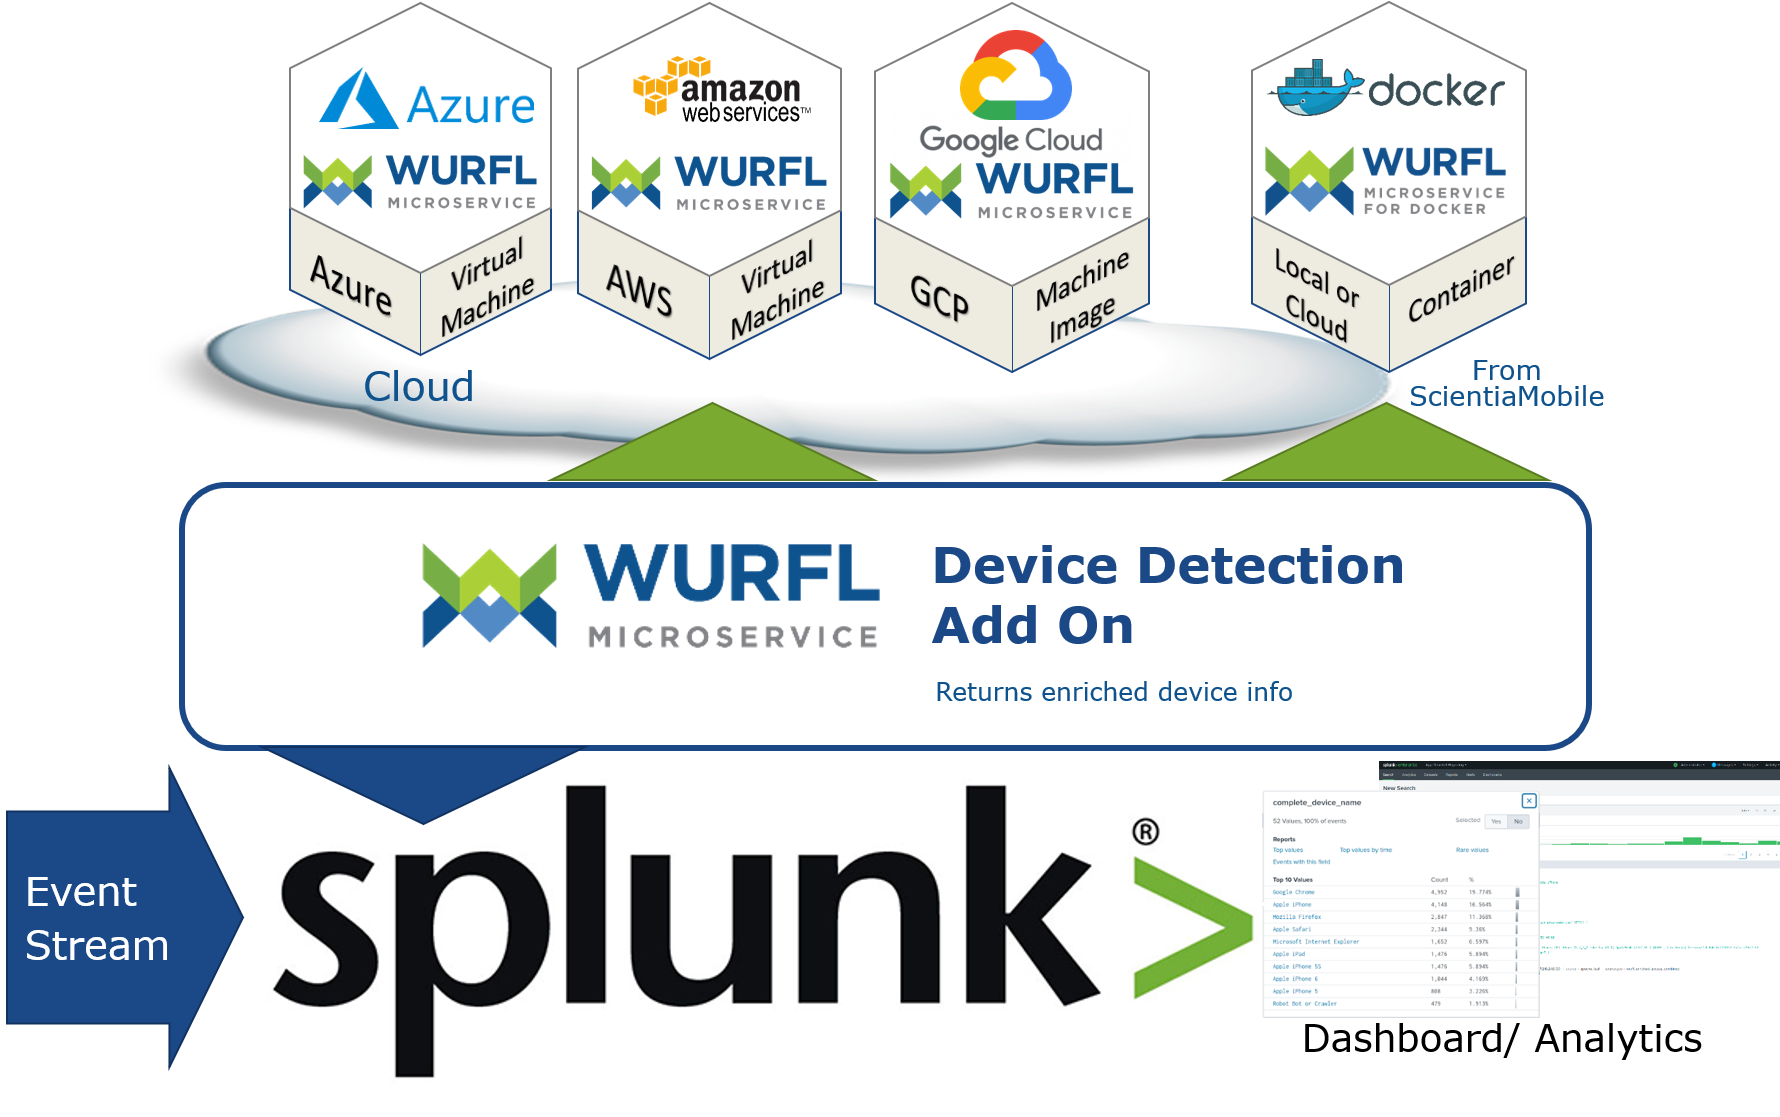
This blog will demonstrate how the WURFL device detection add-on for Splunk works in a simple but concrete scenario. As usual, we need a WURFL API to extract device knowledge from user-agent strings and HTTP requests. The WURFL Microservice add-on for Splunk will enrich your data stream with device information to achieve greater insight into how users interact with your service.

We assume that, as a Splunk user, you are familiar with indexes, events, sourcetype, and scripted input, in addition to the Python programming language.
We will illustrate two use-cases:
-
We will migrate data from a Splunk index to a new index by adding data from WURFL. The source index contains data from the popular Apache and NGINX
access_combinedlog file format. - We will draw data from one or more mod_log_forensic Apache log format.
These two scenarios should be enough for those who know Splunk to create their own add-ons (TAs) that get their data from a DB, a TCP connection, data storage or whatever other data source.
Prerequisites and Dependencies
- Splunk 8.0.x
- Python 3.x
- WURFL Microservice client python 2.2.0 or newer
- pylru
- urllib3
- Splunklib
A WURFL Microservice instance (obtainable from the AWS, Azure or the Google Cloud Platform marketplaces, or directly from ScientiaMobile in the form of a Docker image).
Add-On Structure and Installation
The code for the WURFL Microservice Splunk add-on can be found here.
To install it, simply copy the entire project directory under $SPLUNK_HOME/etc/apps
Restarting Splunk will make the add-on appear in Apps > Manage apps

Here is the TA structure:

There are only two subdirectories, bin and default.
bin contains all of the Python scripts and their dependencies. All the needed dependencies can be downloaded using the command:
$SPLUNK_HOME/etc/apps/TA-wurfl-microservice/bin/requirements.txt --target $SPLUNK_HOME/etc/apps/TA-wurfl-microservice/bin
Note: if you use the pip install command without the –target option, dependencies will be installed where Splunk “cannot see them” (i.e. wherever the default system Python interpreter looks for packages). This is likely different from the Python interpreter used by Splunk internally.
The python scripts contained in bin for our two use cases mentioned above are:
- wm_index_migration.py
- wm_log_forensic_input.py
All the default configuration files for the add-on should go into default. The location of the Splunk configuration files has a well-defined priority order (documented here). The add-on will first try to read the directory:
$SPLUNK_HOME/etc/apps/TA-splunk-microservice/local
and then:
$SPLUNK_HOME/etc/apps/TA-splunk-microservice/default
after that.
For the purposes of this post, you can simply create the default directory and add your config files in there: app.conf, inputs.conf, and inputs.conf.spec
Configuration of Add-ons and Scripts
The default/app.conf file contains basic add-on information that is read by Splunk at startup, such as the add-on name, visibility in the Splunk UI, etc.
The script configurations are found in default/inputs.conf. This file contains basic configurations for wm_index_migration and wm_log_forensic_input.
[script://./bin/wm_index_migration.py]
interval = 300
sourcetype = access_combined
disabled = False
- Line 1 declares the relative path of the script to be executed. The path is relative to the Splunk app-on installation dir:
$SPLUNK_HOME/etc/apps/TA-WurflMicroservice - Line 2 is the interval in seconds between each script execution. If you have a large amount of data, then you should choose a time span large enough to allow the script to complete the migration before the next execution or, better, configure it to run once by assigning -1 to the
intervalparameter and then switch to the periodic execution once the first migration has ended. If you have large datasets, we recommend using WURFL in the ETL phase of your data integration process. Depending on the amount of data you are managing, other WURFL APIs (such as WURFL InFuze or WURFL OnSite) might be a better fit for you. - Line 3 describes the source type of the original data.
- Line 4 is used to enable/disable script execution.
Enriching Apache Logs with WURFL Device Information
Time to dive into our use-cases. Let’s start by migrating a Splunk index containing data taken from an Apache access_combined log file to a new index that contains data from WURFL.
bin/wm_index_migration.py will:
- Define its own log file and format (log files are generated under
$SPLUNK_HOME/var/log/splunk) - Load custom script configuration.
- Create an instance of WURFL Microservice client with:
wm_client = WmClient.create("http", wm_host, wm_port, "")
req_caps = concat_cap_list.split(",")
wm_client.set_requested_capabilities(req_caps)
wm_client.set_cache_size(int(wm_cache_size))
service = connect(host=splunk_host, port=splunk_port, username=user, password=pwd)
splunk_indexes = service.indexes
src_index = splunk_indexes[index_name]
if dst_index not in splunk_indexes:
   new_index = splunk_indexes.create(dst_index)
Note: A checkpoint is a way to keep track of the number of migrated events in case of Splunk shutdown or in case more events need to be migrated in consecutive executions of the script. This checkpoint is a JSON string written on a specific index called wm_index_migration_checkpoint. (more on that later)
rr = results.ResultsReader(service.jobs.export(search_string))
The search string may be set according to checkpoint values
if isinstance(result, results.Message):
item = result["_raw"]
current_timestamp = result["_indextime"]
parts = [
   r'(?P<host>\S+?)',  # host %h
   r'\S+',  # indent %l (unused)
   r'(?P<user>\S+?)',  # user %u
   r'\[(?P<time>.+)\]',  # time %t
   r'"(?P<request>.*?)"',  # request "%r"
   r'(?P<status>[0-9]+?)',  # status %>s
   r'(?P<size>\S+)',  # size %b (careful, can be '-')
   r'"(?P<referrer>.*?)"',  # referrer "%{Referer}i"
   r'"(?P<useragent>.*?)"',  # user agent "%{User-agent}i"
]
try:
   pattern = re.compile(r'\s+'.join(parts) + r'\s*\Z')
   item_dict = pattern.match(item).groupdict()
   user_agent = item_dict["useragent"]
except Exception:
	# error handling here
wm_client.lookup_useragent(useragent)
for rc in req_caps:
   item_dict[rc] = device.capabilities[rc]
item_dict["wurfl_id"] = device.capabilities["wurfl_id"]
new_index.submit(event=json.dumps(item_dict), host=item_dict["host"],
     source=src_index.name, sourcetype="wurfl_enriched_access_combined")
wm_client.destroy()
The script custom configuration is located at default/inputs.conf.spec. Here is a sample configuration:
[wurfl_index_migration]
user = admin
pwd  = myB64encpwd2
host = localhost
port = 8089
src_index = apache_test
dst_index = wurfl_index
wm_host = localhost
wm_port = 8080
wm_cache_size = 200000
capabilities = brand_name,complete_device_name,device_os,device_os_version,form_factor,is_mobile,is_tablet
log_arrival_delay = 300
checkpoint_row_span = 5000
index_post_deletion_sleep=0.9
user and password are the credentials of the internal Splunk user to access the Splunk services via its REST API.
For the sake of this example, password is base64-encoded, but you can (and should) replace the code with a more secure encoding of your choice.
host and port are the ones that expose Splunk REST API endpoints
src_index is the name of the index that contains the data to migrate
dst_index is the name of the destination index where enriched data are copied
wm_host and wm_port are the ones exposed by WURFL Microservice server (running on AWS/Azure/GCP or any server of your choice in case of a Docker image).
wm_cache_size is the size of WURFL Microservice client cache
capabilities is a comma separated list of WURFL device capabilities that you want to use to enrich log data.
checkpoint_row_span is the number of rows that must be read before a write operation to the checkpoint index.
log_arrival_delay is the number of seconds used to adjust the upper bound of time span to handle a possible delay in fetching a record
index_post_deletion_sleep is the number of seconds that the scripts will wait before recreating an index that has just been deleted.
Note: Splunk may take some time before making a deleted index name available again
Important note: the actual WURFL capabilities you can access depend on the WURFL Microservice edition you are using. Docker users (i.e. those who licensed WURFL Microservice directly from ScientiaMobile) can license any WURFL capability.
All configuration parameters are mandatory.
During initialization, Splunk will run $SPLUNK_HOME/bin/splunk start/restart.
From then on, the script runs at regular intervals according to the interval parameter as specified in inputs.conf.
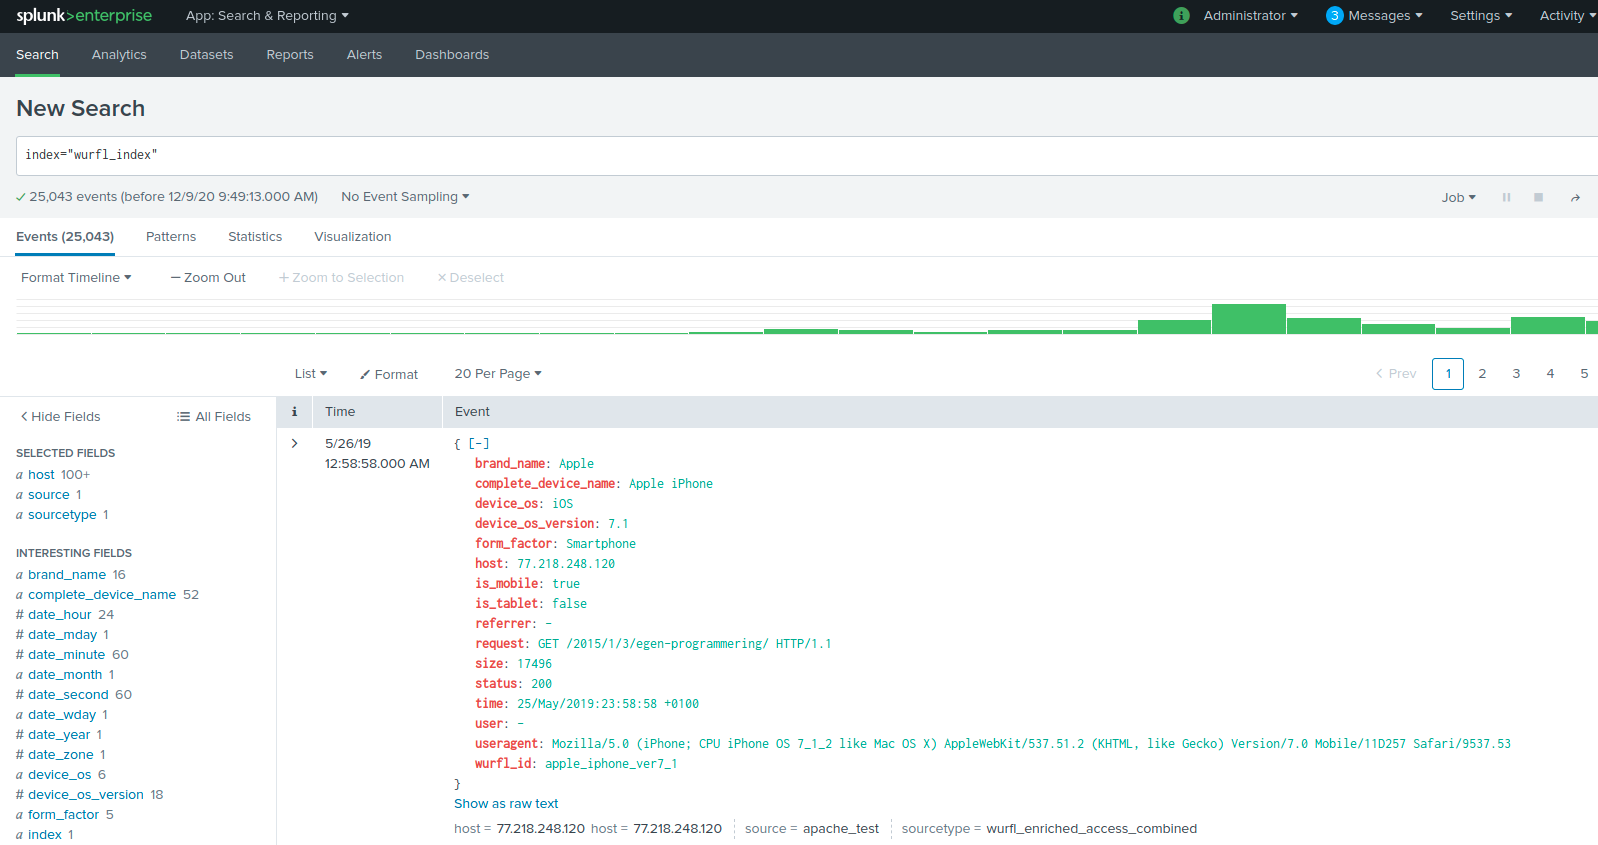
Once the data is migrated, you can search the Splunk UI to view it.

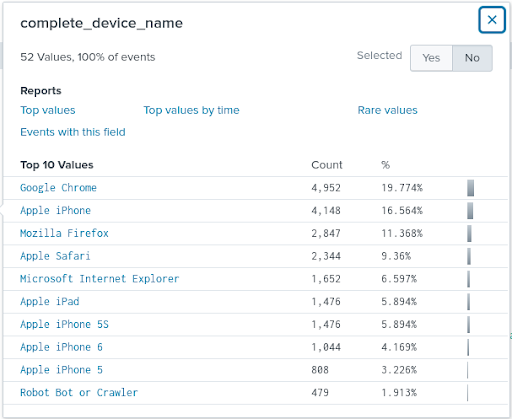
The image above shows the result of a simple search without parameters on the wurfl_index target index. The Splunk event illustrates the structure of a normal access_combined log plus various capabilities taken from WURFL (form_factor, complete_device_name). The left column shows aggregate information on the number of occurrences for each saved piece of data, including WURFL capabilities. Clicking on it will disclose more detailed stats. Let’s drill into the complete_device_name capability for example.

This example of typical website traffic shows the Apple iPhones and iPad mobile devices provide a sizeable amount of traffic. Likewise, desktop traffic also appears, showing under the browser on the desktop (e.g. Google Chrome, Apple Safari).
Integrating WURFL with Forensic Apache Data
As far as the second use case goes, importing one or more Apache files in “forensic” format is similar in concept to the previous scenario, with only minor differences in input data, configuration and code.
The forensic log data in fact, unlike the access_combined ones, show all the headers present in HTTP requests. This allows us to obtain a more accurate device detection in certain cases (for example, side-loaded browsers, such as Opera Mini).
Here’s the configuration section of the input.conf.spec file in
wm_log_forensic_input.py:

[wurfl_log_forensic_input]
user = admin
pwd  = Q3JvdGFsbyQxNzk=
host = localhost
port = 8089
src_fs = /my_path/splunk_inputs/forensic_1k.log
dst_index = wurfl_forensic
wm_host = localhost
wm_port = 8080
wm_cache_size = 200000
capabilities = brand_name,complete_device_name,device_os,device_os_version,form_factor,is_mobile,is_tablet
checkpoint_row_span = 1000
Differences with the previous use case:
- There is a
src_fsparameter which indicates the absolute path of the data source file or directory. If this parameter points to a directory, the script assumes that all files within it are files containing forensic logs. - The
checkpoint_row_spanparameter defines how many rows the checkpoint data needs for its operation. The ability to use multiple (independently updating) files as a data source requires keeping track of the line number for each single input file. This checkpoint is written in JSON format on a specific index calledwm_forensic_checkpoint.
This Index should never be deleted unless you intend to import the data again. Writing on the checkpoint more frequently makes it possible to keep track of the progress of the import but may slow performance down.
The checkpoint management is done using the should_write_checkpoint and write_checkpoint functions. As for the detection, the WURFL Microservice client uses the lookup_headers method. HTTP headers (extracted from each log entry) are passed to the method this way:
tokens = line.split('|')
host = "-"
headers = dict()
out_data = dict()
out_data["forensic_id"] = tokens[0]
out_data["request"] = tokens[1]
out_data["_raw"] = line
for tok in tokens:
   if ':' in tok:
       header = tok.split(':')
           [..some boilerplate..]
           headers[header[0]] = header[1]
device = wm_client.lookup_headers(headers)
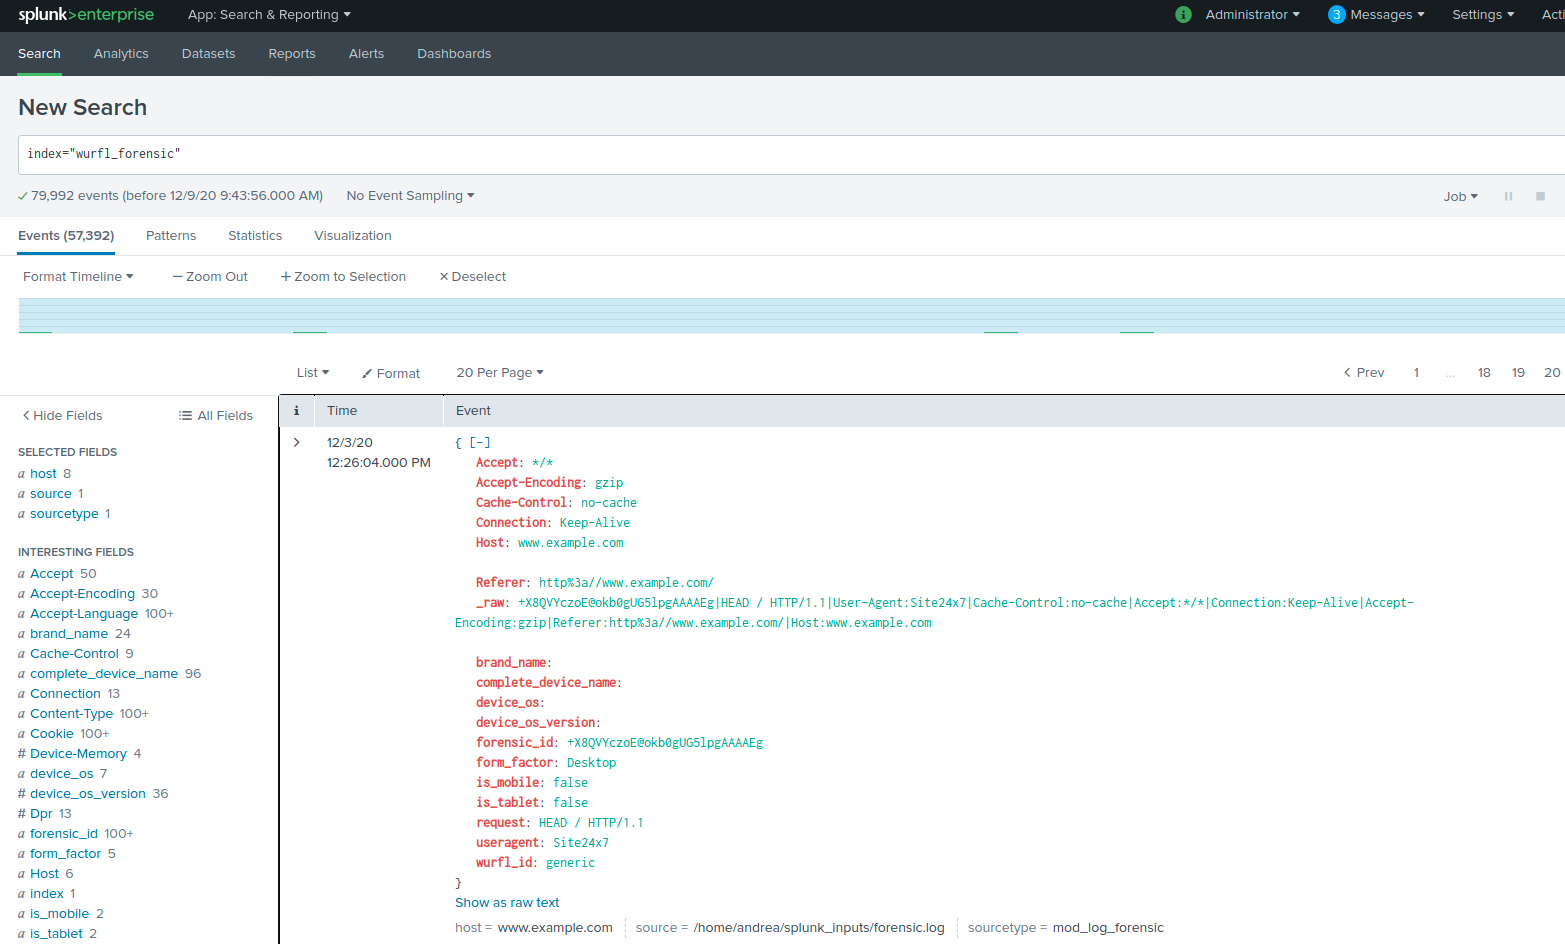
The result of the import operation is visible in the figure that follows:

WURFL Microservice vs. WURFL InFuze API
For this purpose of this blog, we have used WURFL Microservice. The rationale behind this choice is that an instance of WURFL Microservice can be obtained from the marketplaces of the major Cloud Service providers (AWS, Azure, GCP). If you have specific needs for a faster API, ScientiaMobile offers several other options in the form of APIs for all popular programming languages and modules for web servers, proxies and load balancers. A natural match for a Splunk is WURFL InFuze for Python.
Conclusions
We have shown how Splunk users can integrate WURFL device detection with their Splunk-based data process.
We have provided two examples that can be used to easily build a scripted input to:
- Import data from any source,
- Enrich it with WURFL properties and
- Make it available to the Splunk search and aggregation engine.
If you are a Splunk user, you are probably already seeing new possibilities for analysis of your existing data which will give you greater insight.


